What are KPIs (Key Performance Indicators)?
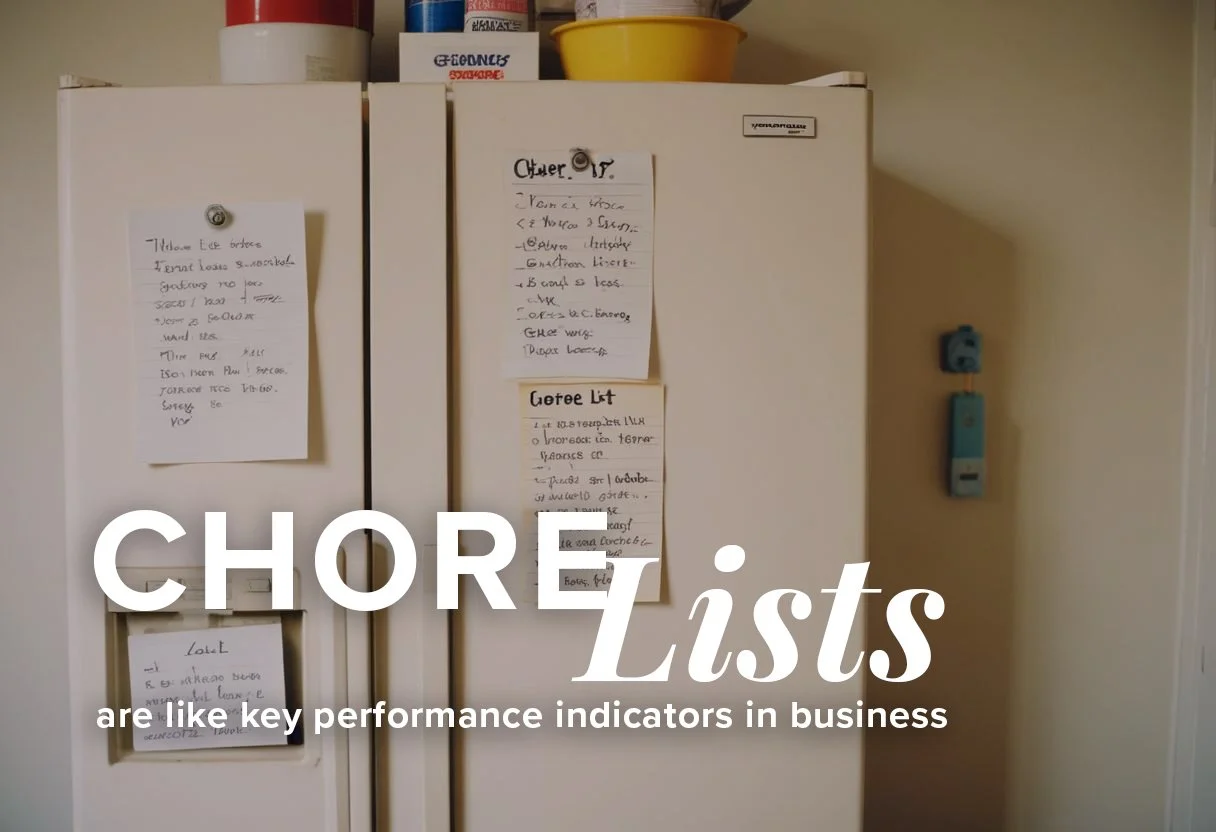
Key performance indicators are akin to a chore list you might have had as a kid. Essentially, KPIs are a set of activities that require monitoring by a simple “yes” or “no”. In some cases, plotting a numeric number is required to answer the KPI.
For example, a chore list might have looked like this, held by a magnet onto the front of the fridge:
On the list, you might have had:
Take out the trash
Wash the dishes
Fold the laundry
Sweet off the front porch
By the time your parent(s) arrived home from running errands, the expectation was that those things should have been done. They would walk up to the fridge and go down the list, one by one, “Did you wash the dishes?” You would answer, “yes”, or “no”. If your parent was super OCD, they may ask you “how many dishes did you wash?” Let’s say it was your job to wash the dishes every day for 5 days straight, and each day, you washed a different number of dishes. Like so:
Monday: 12 Dishes
Tuesday: 5 Dishes
Wednesday: 7 Dishes
Thursday: 9 Dishes
Friday: 28 Dishes
You might notice that on Friday the dish-count more than doubled compared to Monday and on Tuesday, the dish count was lowest. This type of numeric data plotting may tell you a lot about what is happening throughout a given time span and it may help you understand over time that, if you keep your dish count lower, you also keep your water bill lower. Had you been plotting the data of your monthly water bill alongside the data of your dish count, as a separate key performance indicator, you may notice a correlation between higher dish counts and higher water bill months.
Now, odds are, you didn’t have to count dishes that you washed daily which could make it a bit challenging to keep focused on the example for the sake of the principal here. This rudimentary example is the essence however, of key performance indicators and the relationships between two (or more) KPIs to make informed decisions about your business.
Let’s Take it Back to a Business-Example
You create a spreadsheet and in Column A, you write down the various KPIs and in Columns B —> onward, you jot down a calendar year, starting with January through to December, one month labeled in the top cell of each column. Then you go back to Column A and decide to track “gross revenue” as a key performance indicator of your success. Why would you do that? You must know what money you’re bringing into the business, at least on a monthly monitoring system. You’ll also be able to find this in a report from your accountant known as a P&L (profit and loss) statement, but more on that later. For your own sake, it can be a good KPI to pay attention to and is usually the most fundamental one any business owner would monitor.
So let’s say your data is starting to look like this:
January: $4,000 Gross Revenue
February: $2,500 Gross Revenue
March: $13,000 Gross Revenue
Even by one quarter’s worth of plotted data, you can discern the following:
Your average gross revenue thus far is: $6,500. Even though you wouldn’t expect that at a quick glance, March did so well that is raised your average.
If your goal was to gross $78,000 in revenue in a calendar year, you’re technically still on pace. Even though two months underperformed on the quarter, your month of March kept you on pace.
Then you can deep dive into March’s success and reverse-engineer (if you don’t quite know how you got there to begin with), what you were doing to drive that type of success. In this way, you’ll be able to more quickly and efficiently recreate it.
All in all, this is the power of KPIs. Knowledge about your business comes from tracking and monitoring KPIs.

